Topic Four: Two and three component mixtures
- Temperature composition diagrams, Description of non-volatile 2-component liquid mixtures.
- Ternary Phase Diagrams for 3-Component liquid mixtures.
- Lever Rule.
- Gibbs Phase Rule.
(a) Two component systems: we will describe these with Composition - Temperature diagrams. Physically we are interested in the interplay between intermolecular interactions and thermal motion. Depending on their relative strengths, there may be one or two phases present.
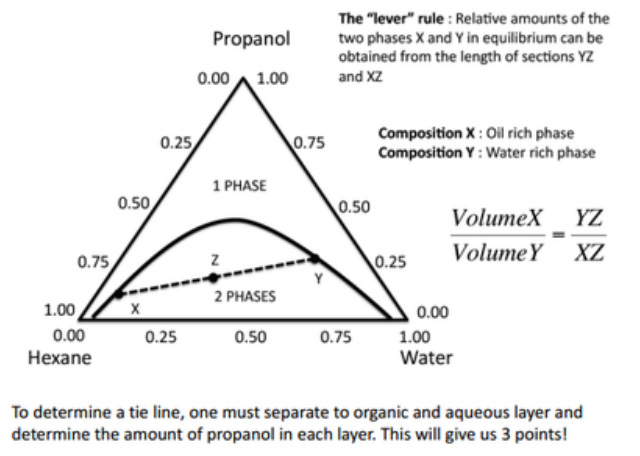
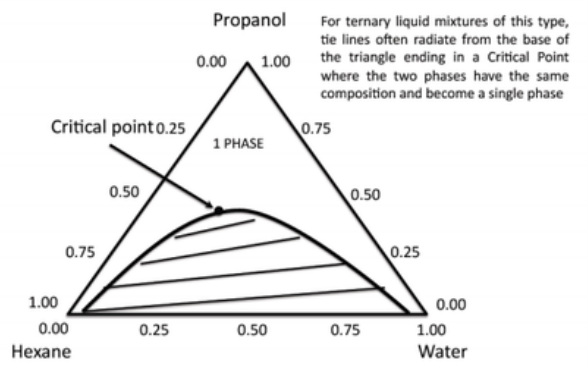
(b) Three component systems: can be described by ternary phase diagrams. These map the mole functions on triangular graph paper at constant temperature and pressure. Ternary phase diagrams are used to represent phase behaviour when three liquid components are present.
Two components and Liquid Miscibility
If we have two liquids A (solvent) and B (solute), and T < TA boiling, TB boiling
The liquids can mix together in either one or two phases (assuming the concentration of B is high enough).
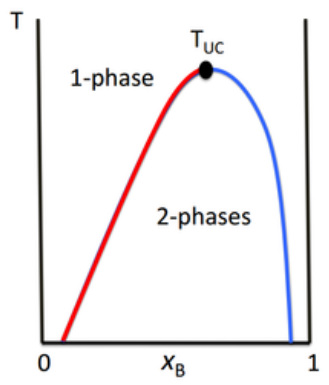
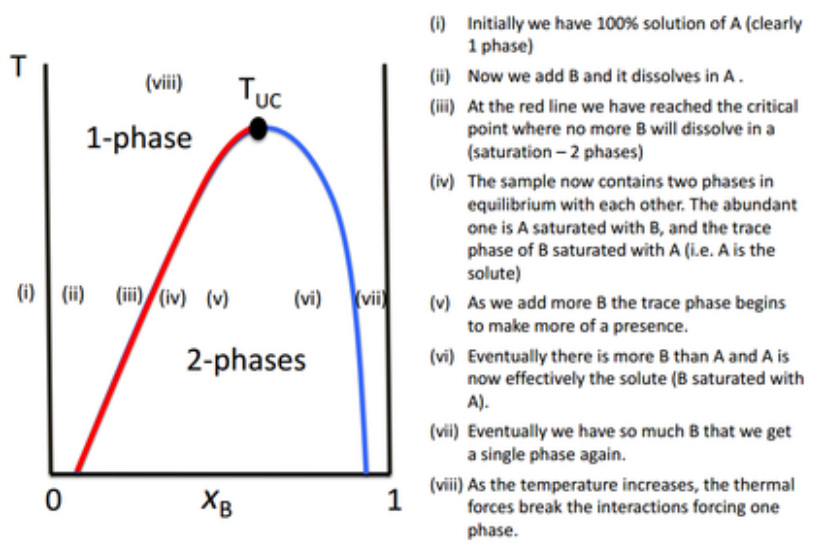
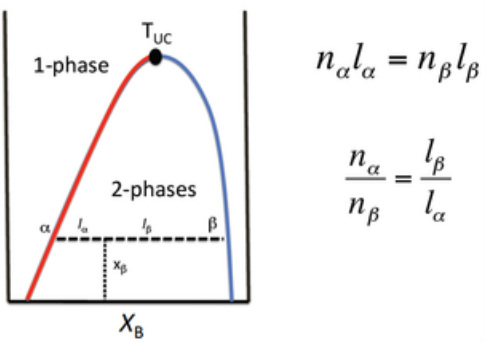
Many binary liquid mixtures show an Upper Critical Solution Temperature (TUC).
This is the highest temperature at which phase separation occurs.
Above this temperature, the two components become fully miscible!
(b) Three component systems: can be described by ternary phase diagrams. These map the mole functions on triangular graph paper at constant temperature and pressure. Ternary phase diagrams are used to represent phase behaviour when three liquid components are present.
Two components and Liquid Miscibility
If we have two liquids A (solvent) and B (solute), and T < TA boiling, TB boiling
The liquids can mix together in either one or two phases (assuming the concentration of B is high enough).
Many binary liquid mixtures show an Upper Critical Solution Temperature (TUC).
This is the highest temperature at which phase separation occurs.
Above this temperature, the two components become fully miscible!
|
Diagrammatically - Upper Critical Solution Temperature
Example
Hexane and nitrobenzene Raising the temperature increases their miscibility. This occurs because thermal motion reduces the tendency of the molecules of the same type to stay together. |
Diagrammatically - The details
|
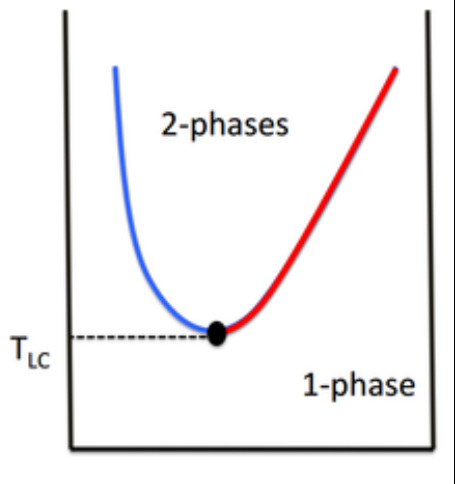
Lower Critical Solution Temperature
Some liquid mixtures show a lower critical solution temperature (LCST) Below this temperature they mix, above this temperature they form two phases. This occurs when the components form weak complexes, thereby promoting miscibility. This is destroyed with increasing temperature. e.g. water and triethylamine Diagrammatically - Lower Critical Solution Temperature
At low temperatures, weak complexes form and only a single phase is seen.
Increasing the temperature forces these complexes to break and then two phases form. |
Ternary Phase Diagrams
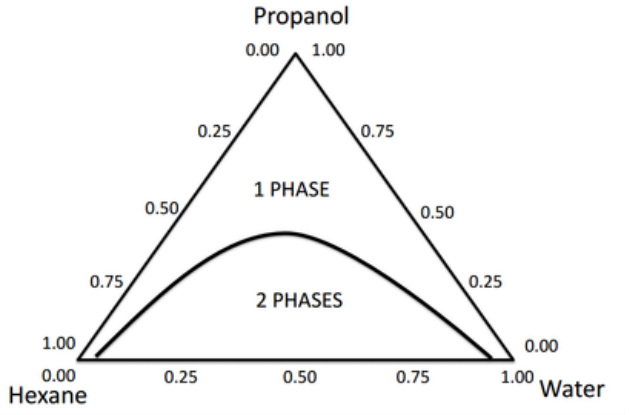
These diagrams are often useful in liquid mixtures where two of the components are immiscible (e.g. hexane and water) but each is completely miscible with the third (e.g. propanol).
In this case, complete miscibility of the two immiscible components can be achieved by addition of enough of the common miscibility component (propanol).
Real systems of interest
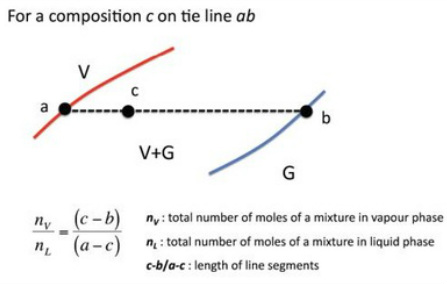
The lever rule
Used in the 2-phase region of a phase diagram. Describes both qualitatively and quantitatively the relative amounts of both phases.
To find the relative amounts of the two phases that are in equilibrium, measure the distances along the horizontal tie line, and then use the lever rule,
Used in the 2-phase region of a phase diagram. Describes both qualitatively and quantitatively the relative amounts of both phases.
To find the relative amounts of the two phases that are in equilibrium, measure the distances along the horizontal tie line, and then use the lever rule,
Sample Question
A mixture of 100 g of hexane (C6H6) and 100 g of nitrobenzene (C6H5NO2) was prepared at 290 K. What are the compositions of the phases and in what compositions do they occur? To what temperature must the sample be heated in order to obtain a single phase?
A mixture of 100 g of hexane (C6H6) and 100 g of nitrobenzene (C6H5NO2) was prepared at 290 K. What are the compositions of the phases and in what compositions do they occur? To what temperature must the sample be heated in order to obtain a single phase?
Tertiary Mixtures: The Lever Rule
Tertiary Mixtures: Critical Point
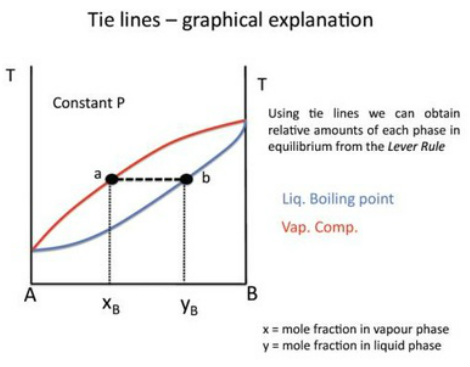
The importance of Tie Lines
On a 2 component temperature - composition diagram, a tie line for a specific temperature gives us the ratio of liquid and vapour components.
That is, the ratio of moles in the liquid vs vapour phase
On a 2 component temperature - composition diagram, a tie line for a specific temperature gives us the ratio of liquid and vapour components.
That is, the ratio of moles in the liquid vs vapour phase
|
|
Gibbs Phase Rule
This is a mathematical rule that tells us the total number of parameters that can be changed independently (to a small extent), while the number of phases in equilibrium is preserved.
F = C - P + 2
Where:
F : number of parameters that can be changed independently
C : number of components in the system
P : number of phases in equilibrium
This gives us an intuitive way to think about equilibrium between any number of phases. Probably be described by a familiar example.
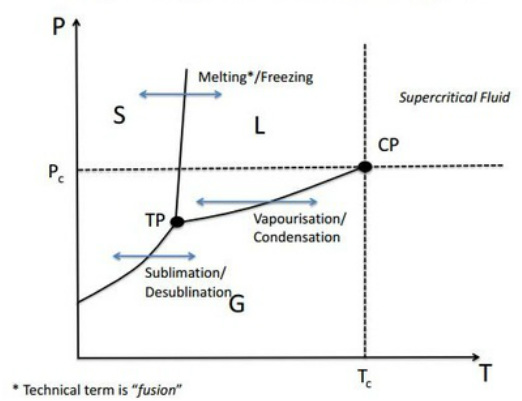
Application of Gibbs Phase Rule: Single component phase diagram
This is a mathematical rule that tells us the total number of parameters that can be changed independently (to a small extent), while the number of phases in equilibrium is preserved.
F = C - P + 2
Where:
F : number of parameters that can be changed independently
C : number of components in the system
P : number of phases in equilibrium
This gives us an intuitive way to think about equilibrium between any number of phases. Probably be described by a familiar example.
Application of Gibbs Phase Rule: Single component phase diagram
|
Number of components in system (C) = 1
therefore: F = C - P + 2 F = 1 - P + 2 F = 3 - P
|
Summary of Important Concepts: Two and three component mixtures
- Many liquid mixtures can mix together in two different phases. This depends on relative concentrations (mole fractions) and the temperature.
- Some mixtures show an Upper Critical Solution Temperature and others show a Lower Critical Solution Temperature
- 3 - Component mixtures can be described by Ternary Phase Diagrams
- The lever rule can be used to calculate the relative amounts of two phases (X & Y) in equilibrium by division of a tie line.
- The Gibbs Phase rule predicts the allowed form of all phase diagrams of single phase and equilibrium regions.
