The spectroscopic analysis of transition metals can give some key data to the splitting energies of different transition metal groups.
Work coming to this page soon!
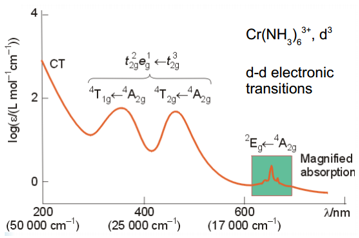
The transitions here show that at high wavenumbers there are the charge transfer tranisitons. These are orbital allowed and spin allowed. The two peaks in the middle (the most interesting from our standpoint) are inter-orbital d transitions these are spin allowed but orbital forbidden making them much less strong that the charge transfer transitions.
The final peaks labelled green here are transitions that are both spin and orbital forbidden making them the least intense of all the transitions.
The final peaks labelled green here are transitions that are both spin and orbital forbidden making them the least intense of all the transitions.
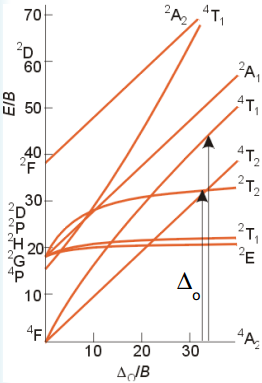
The most important graph is the Tanabe-Sugano diagram. This is a diagram that shows the relationship between the ground state 4A2 at the bottom and the excited states. The important excited states are the ones that have the same multiplicity, in this case 4. These are a measure of all of the orbitals that electrons can be excited into. The first of these the 4T2 represents the octahedral splitting energy. The axis in this example are the energy over B. B is the electron-electron repulsion terms and can explain the interactions between them.
So using the diagram above and knowing the relationship between the two transitions allows the Δ0/B value to be read. This can then be compared to the E/B value which is known as this is related to the Δ0.
So using the diagram above and knowing the relationship between the two transitions allows the Δ0/B value to be read. This can then be compared to the E/B value which is known as this is related to the Δ0.
