Electronic spectroscopy of diatomic and polyatomic molecules
Electronic spectroscopy of molecules can be a very powerful technique for finding the in depth knowledge of structure such as bond length and bond dissociation energies which can give a lot of information into bond breaking/ formation.
Triatomic molecules can be analysed to find structure and linear/ bent bond angles. These can be related with the Walsh correlation diagram which is a more sophisticated version of VSEPR.
Diatomic molecules
The type of electronic spectrum seen is based on the positions of the ground and excited states. The electronic states that are present in a molecule are described as Potential Energy Surfaces or PES, there are three different types of PES transitions that can occur.
Bound to bound
Bound to bound transitions are the electronic transitions between two states that are both stable. This transition can show vibrational and rotation structure at high resolution. Emission can also be seen due to the production of a photon. The analysis of these structures can yield bond length and dissociation energy.

The graph above shows three transition states. To explain what these graphs are referencing a better understanding of the terms shown needed to be taken.
The general shape of the graph (the curve) is based on the Morse potential, this is a highly useful formula as it is a direct solving of the Schrodinger equation.
The general shape of the graph (the curve) is based on the Morse potential, this is a highly useful formula as it is a direct solving of the Schrodinger equation.
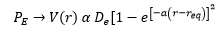
This shows that the potential energy at a given distance is proportional to the dissociation energy and an exponential function that describes the distance in bond length from the equilibrium bond length. This is where a is related to the reduced mass of the molecule.
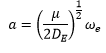
This is where ωe is the harmonic frequency which will come up again shortly.
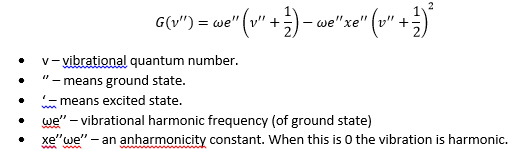
The Morse function leads to quantised energy levels of decreasing separation with an increase in energy. This is the anharmonic effect. As the quantum number increases so does the energy which can be represented by the following equation:
The Morse function leads to quantised energy levels of decreasing separation with an increase in energy. This is the anharmonic effect. As the quantum number increases so does the energy which can be represented by the following equation:
Intensity of vibronic transitions in the case below rely on wavefunction overlap. The overlap of each wavefunction gives the intensity in the three graphs shown below there are varying intensities of the bands in the spectrum.
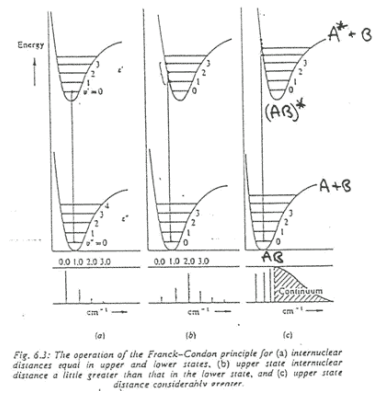
Firstly, taking (a) into account. The excited and ground state have the same bond length so the potential energy surface (PES) does not move from its desired position. This means that there is (near) perfect overlap between the ground and excited state in the first vibrational energy level.
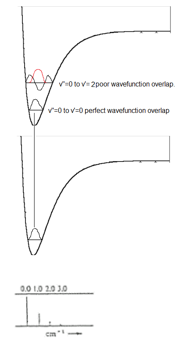
In (b) the excited state has a different PES than the ground state. This means that the overlap changes. In the higher energy levels more wavfunction density is found closer to the edges meaning there is more overlap with the ground state and higher energy excited states then there is the v'=0 excited state. This means these bands become more intense.
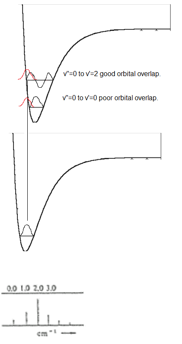
The example (c) is an important case in which the Bound to Bound transition causes the bond to break. This is because the electron has been excited into a band which causes the dissociation of the molecule. This leaves the two atoms making up the diatomic molecule, one of these is usually in its excited state which causes a continuum in the higher energy band.
The intensity explained as a wavefunction form
The intensity of the peak is based on the following equation
The intensity of the peak is based on the following equation
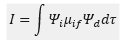
This is where dτ is the volume of the integral over all space. The μif value is the transition dipole operator. The product of this can be reduced to two terms one which is based on vibronic and the other electronic operations of the wavefunction.
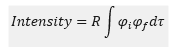
This is where R is the electronic form and φf is the vibronic function. This means that at larger overlaps this value becomes larger and there is a larger intensity.
From the analysis of the diatomic spectra the objective is to determine the ωe’ and the ωe’xe’ values from the absorption spectrum. The method involves the construction of first and second differences.
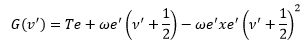
The energy of the upper state is given by:
This is where Te is the electronic energy that the molecule already has.
From the analysis of the diatomic spectra the objective is to determine the ωe’ and the ωe’xe’ values from the absorption spectrum. The method involves the construction of first and second differences.
The energy of the upper state is given by:
This is where Te is the electronic energy that the molecule already has.
Assuming all molecules start at ν’’ = 0 the first and second energy differences need to be taken into account.
The first difference yields:
The first difference yields:

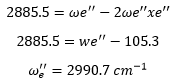
The second difference yields:

This is very useful for the analysis of the molecule.
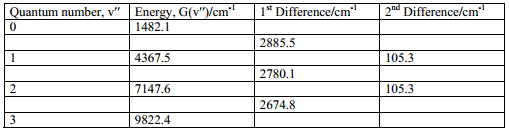
In this example the second difference is 105.3 cm-1 this means that the anharmonicity constant is equal to 52.65 cm-1. The first difference is taken which equates to:
The dissociation vibronic state can be calculated from the equation:
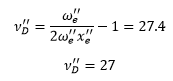
This number is always rounded to the nearest integer.
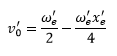
The zero point energy can be found by the equation:
The zero point energy can be found by the equation:
This can also be converted into the dissociation energy:
This can be converted into Joules using NAhc
Giving the dissociation energy of: 508 kJ mol-1
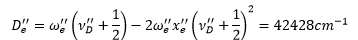
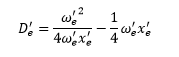
This gives the first method of calculating De’’ the other method of this is to use the graphical measurement which uses the fact that the energy level spacing tends to 0. So at dissociation:
Giving the dissociation energy of: 508 kJ mol-1
This gives the first method of calculating De’’ the other method of this is to use the graphical measurement which uses the fact that the energy level spacing tends to 0. So at dissociation:

So when dissociation occurs.
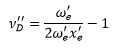
v’D is the shape parameter. This can be calculated from the graph giving the energy of dissociation. Using the equation:
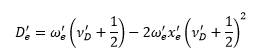
This is the same equation but specified at dissociation through analysis of a spectrum all of these number are now known. This allows calculation of the ground states and 1st and 2nd differences using the same equations above. Combining these two equations gives:
This allows linear extrapolation forming the Birge-Sponer plot.
The area under the graph is De.
The area under the graph is De.
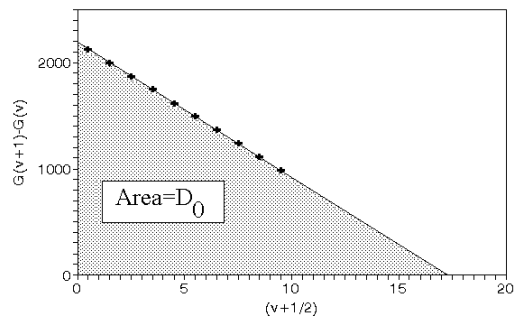
This always gives a slightly smaller answer by around ~10% due to the fact that the larger terms are not taken into account x3 etc.
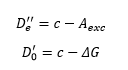
The absorption spectrum gives De’ and the emission spectrum gives De’’
Another approach is the observation of a continuum this is useful as it corresponds to appearance of atomic emmisions If there is the appearance of atomic emission the ground state and excited state can be calculated.
The absorption spectrum gives De’ and the emission spectrum gives De’’
Another approach is the observation of a continuum this is useful as it corresponds to appearance of atomic emmisions If there is the appearance of atomic emission the ground state and excited state can be calculated.
Rovibronic spectroscopy
The vibration transition under high resolution reveals very detailed analysis of the vibrational structure. This shows when there is shading to the red or shading to the blue. Under high resolution the asymmetry yields information or to the bond length and the excitation of the electronic state. This is where pure rotational spectroscopy is used.
The vibration transition under high resolution reveals very detailed analysis of the vibrational structure. This shows when there is shading to the red or shading to the blue. Under high resolution the asymmetry yields information or to the bond length and the excitation of the electronic state. This is where pure rotational spectroscopy is used.
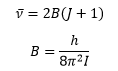
Where I is the moment of inertia:

The vibrational spectrum gives two families of equally spaced lines known as P and R branches.
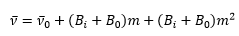
Experimentally the lines are not equally spaced, the R branch normally converges. With increasing mass the P branch converges. This is due to the req is slightly different due to anharmonicity as a consequence of this B0 becomes Bi.
Experimentally the lines are not equally spaced, the R branch normally converges. With increasing mass the P branch converges. This is due to the req is slightly different due to anharmonicity as a consequence of this B0 becomes Bi.
As the mass increases the frequency goes back on itself.
Triatomic molecules
Triatomic molecules have an extra degree of movement. This movement is closly linked to the molecule being able to move from a linear to a bent structure. It is hard to tell just by looking which it is likely to be although with knowledge of stabalisation energies and how VSEPR in a LCAO type way can be used to explain the formation of linear and bent groups.
In these examples we only consider triatomic main-main group dihydrides.
A triatomic molecule can either be linear or bent with an angle of separation between the two structures.
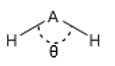
This can be represented by the following atomic orbital overlap to form molecular orbitals:
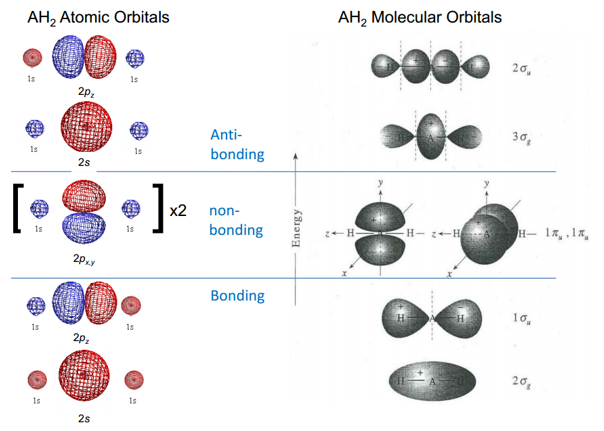
This is simple VSEPR and is nothing new. This representation only shows the single axis, so it has to be remembered that there are p orbitals in all 3 axis which interact differently in the even of a bending motion.
This means that at a different angle of θ there is a different interactions with the non-bonding orbitals. As the two 1s orbitals move downwards they become closely to the nodes and therefore lose symmetry. Changing them from non-bonding to bonding orbitals. This stabilises these orbitals. It is important to be able to draw these and show how the bonding becomes more favoured at these different positions.
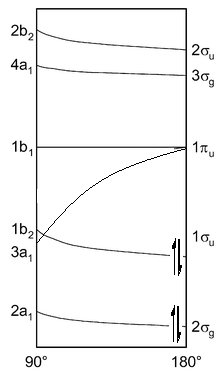
This can be best represented by the Walsh energy diagram. This turns the different molecular orbitals into energy levels. This explains why some molecules prefer to be in a bent or linear state.
This means that at a different angle of θ there is a different interactions with the non-bonding orbitals. As the two 1s orbitals move downwards they become closely to the nodes and therefore lose symmetry. Changing them from non-bonding to bonding orbitals. This stabilises these orbitals. It is important to be able to draw these and show how the bonding becomes more favoured at these different positions.
This can be best represented by the Walsh energy diagram. This turns the different molecular orbitals into energy levels. This explains why some molecules prefer to be in a bent or linear state.
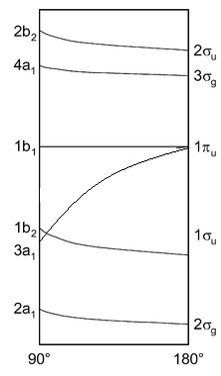
This shows how the energies of orbitals vary depending on the angle between the hydride groups. All of the orbitals are lower in energy at the 180° except for one of the non-bonding π orbitals. When there is a bend one of these orbitals stabilises a large amount from 180° down to 90°. This means that if this orbitals has electrons present in it can be favourable for the molecule to bend slightly to reduce the energy from this molecule.
This can be very easily seen in the following example.
Beryllium dihydride has 4 electrons present in its valence shell.
This means that the following orbitals are being occupied by electrons:
This can be very easily seen in the following example.
Beryllium dihydride has 4 electrons present in its valence shell.
This means that the following orbitals are being occupied by electrons:
This shows how it is favourable for all of the electrons present to be in the linear combination or orbitals to allow the minimum energy, but what about when one electron is promoted into the next energy level?
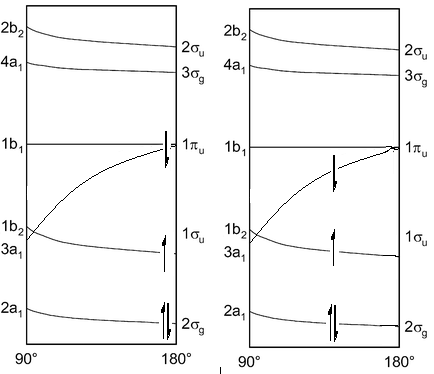
This diagram on the right shows the initial structure, there would be a very high energy electron caused by the fact that it is filling the π orbital. This would act to bend the molecule so it could be lower in energy. In doing this the energy of the other two orbitals begin to rise which means it is favourable if these electrons found an energy equilibrium. This is the explanation behind why it is not normal to see molecules in 90° bond angles but still slightly bent. The diagram on the right shows a minimum energy point.
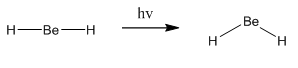
This means the molecule will go from linear to bent when excited:
This means the molecule will go from linear to bent when excited:
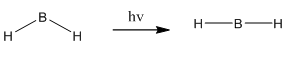
The opposite happens for boron dihydride. As this has 5 valence electrons the following diagram on the left shows the initial bent structure. Whereas on promotion of an electron the diagram on the right shows the excited state:
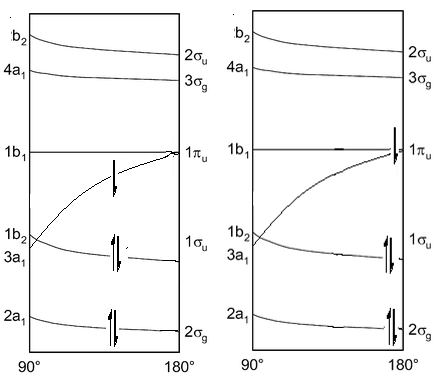
The diagram on the left has had an electron excited into the 1b1 orbital which now has no electronic favourability to how the molecule is angles. This causes the molecule to then become linear.
Polyatomic spectroscopy
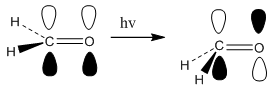
When there are more than 3 atoms there is a possibility for the molecule to move in three dimensions. This occurs in the formaldehyde molecule where there is a planar ground state. On excitation there is a π to π* transition. This has the energetic advantage of the molecule being able to move out of the plane. Normally the hydrogen atoms move downwards forming a stabalised structure. The movement of this is not that necessary to understand and this method of analysis is only a qualitative measure of what is occurring.
When there are more than 3 atoms there is a possibility for the molecule to move in three dimensions. This occurs in the formaldehyde molecule where there is a planar ground state. On excitation there is a π to π* transition. This has the energetic advantage of the molecule being able to move out of the plane. Normally the hydrogen atoms move downwards forming a stabalised structure. The movement of this is not that necessary to understand and this method of analysis is only a qualitative measure of what is occurring.
More complex molecules can be analysed using high end software packages.
Unsaturated polyatomic molecules can be analysed using particle in a box theory. This is discussed in earlier lectures. This shows how conjugation increases the energy gap between levels decreases. This is based on:
Unsaturated polyatomic molecules can be analysed using particle in a box theory. This is discussed in earlier lectures. This shows how conjugation increases the energy gap between levels decreases. This is based on:
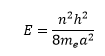
Where n is the energy level and a is the length of the box. The highest unoccupied MO leads to the transition of:
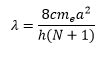
This is where N is the number of carbon atoms in the polyene group.
Proteins
Cis-trans isomerism is seen in most of these reactions when conjugated polyenes become a different shape to allow a different interaction with a protein.
Proteins
Cis-trans isomerism is seen in most of these reactions when conjugated polyenes become a different shape to allow a different interaction with a protein.
