Nuclei can have spin angular momentum, this is an intrinsic property of the nucleus that is impossible to quantify classically. This intrinsic property can allow the analysis of a large number of nuclei which have a non-zero spin. The ability for NMR to indirectly measure the electron density of each nuclei makes this a highly useful analytical tool.
Fundamental’s of NMR spectroscopy
NMR uses the property that nuclei have known as “spin”. The spin is related to the angular momentum and can be quantised. This is known as the total spin angular momentum P.
NMR uses the property that nuclei have known as “spin”. The spin is related to the angular momentum and can be quantised. This is known as the total spin angular momentum P.
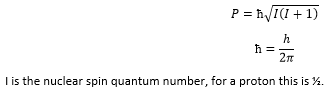
I is the nuclear spin quantum number, for a proton this is ½.
|
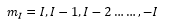
Nuclear spin angular momentum can be defined by a direction using the projection onto the z axis. The spin number can be given as 2I+1 values. These are defined as:

|
This is where mI is the spin quantum number. There are limited allowed values for mI and they all depend on the nuclear spun quantum number I. There are 2I+1 values possible from mI to –mI.
|
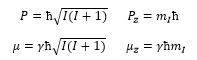
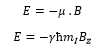
The nuclear magnetic moment can be given by:

This is where γ is the gyromagnetic ratio.
|
The angular momentum and the magnetic moment can be shown through the gyromagnetic ratio:
The nuclear spin quantum number is related to the number of neutrons and protons present. The issue with large values for the nuclear spin quantum number is the formation of the quadrupole which is often broad lines which are not as useful in a spectrum.
Common spin ½ nuclei are:
Common spin ½ nuclei are:
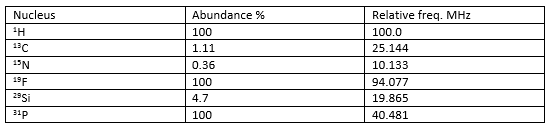
This table above shows the large difference in relative abundances of some of these spin ½ species.
Effect of a magnetic field
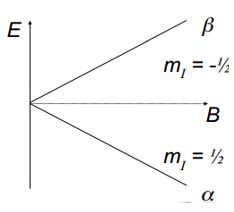
Nuclear energy levels are defined by the mI value. When there is an absence of a magnetic field all the values of mI are present but degenerate to one another.
The magnetic field induced across a nucleus with a set spin causes a splitting between a high energy and a low energy. β is the high energy state and α is the low energy state given by the formula:
Effect of a magnetic field
Nuclear energy levels are defined by the mI value. When there is an absence of a magnetic field all the values of mI are present but degenerate to one another.
The magnetic field induced across a nucleus with a set spin causes a splitting between a high energy and a low energy. β is the high energy state and α is the low energy state given by the formula:
The splitting the field depends on whether the nucleus takes up a high or a low spin state. The signal intensity is from a population difference rather than the populations themselves.
|
The transition of an electron from one energy to another involves the change of spin.

|
The energy of each spin state is given by the same value but in the negative and positive:
Opposing high energy spin: 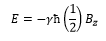
|
Opposing low energy spin:

|
This means the difference in energy is given as:

|
Resonance frequency
Electromagnetic radiation of appropriate frequency induces transitions between these states. This shows how the frequency is dependent on the magnetic field.
Electromagnetic radiation of appropriate frequency induces transitions between these states. This shows how the frequency is dependent on the magnetic field.
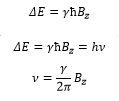
This is known as the lamour frequency and it detects the characteristic frequency of the two resonance states.
Intensity
The spectrum of the molecule corresponds to the spectrum from a large number of molecules in different energy states. For a spin of ½ nucleus the population of different states ig given by the Boltzmann distribution law:
Intensity
The spectrum of the molecule corresponds to the spectrum from a large number of molecules in different energy states. For a spin of ½ nucleus the population of different states ig given by the Boltzmann distribution law:
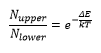
This is where Nupper the number of electrons is in the upper energy level and Nlower is the number of electrons in the lower level.
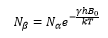
The intensity of the Boltzmann distributions of nuclear spins across the energy levels. This can be represented by the following equation representing the high β and low α energy states.
The intensity of the Boltzmann distributions of nuclear spins across the energy levels. This can be represented by the following equation representing the high β and low α energy states.
The probability of finding an nucleus in the lower spin state than the higher spin state is represented by the following:
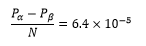
This means that for 105 nuclei less than seven are in one population over another. This means when all other things are equal signal intensity increases with: rise in magnetic field, rise in gyromagnetic constant, and decrease in temperature. This is because low temperature causes less Boltzmann distribution causing a larger difference between high and low ground states.
Due to the number of relations between signal and different properties of the analyte NMR is a very insensitive technique. Only about 4 in 105 photons are absorbed at 10T. This means that everything needs to be done to increase signal intensity.
To increase signal intensity:
· The magnetic field can be increased.
· A larger energy difference can be present.
· The frequency can be higher.
· The gyromagnetic ratio can be larger.
· Lower temperature can be used.
· The sample concentration can be increased.
The frequency and the energy difference will increase with magnetic field and gyromagnetic ratio.
The more nuclei the stronger the signal, this is obvious as more photons can be absorbed for a chemical splitting environment. This means that it is obvious to see the difference in the number of nuclei at a certain chemical environment.
The chemical shift scale
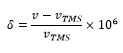
The direct measurement of the electron density and the absolute effect this has on the magnetic field (the shielding constant) is almost impossible. It would require a large number of very precise measurements. This is avoided by measuring the frequencies with respect to a reference. This chemical shift δ is normally measured against tetramethylsilane (TMS) which has well shielded protons all in the same chemical environment to give a large singlet signal.
The chemical shift allows an accurate representation of the different values of the shielding constant for each nucleus present. The definition of the chemical shift is given as:
Due to the number of relations between signal and different properties of the analyte NMR is a very insensitive technique. Only about 4 in 105 photons are absorbed at 10T. This means that everything needs to be done to increase signal intensity.
To increase signal intensity:
· The magnetic field can be increased.
· A larger energy difference can be present.
· The frequency can be higher.
· The gyromagnetic ratio can be larger.
· Lower temperature can be used.
· The sample concentration can be increased.
The frequency and the energy difference will increase with magnetic field and gyromagnetic ratio.
The more nuclei the stronger the signal, this is obvious as more photons can be absorbed for a chemical splitting environment. This means that it is obvious to see the difference in the number of nuclei at a certain chemical environment.
The chemical shift scale
The direct measurement of the electron density and the absolute effect this has on the magnetic field (the shielding constant) is almost impossible. It would require a large number of very precise measurements. This is avoided by measuring the frequencies with respect to a reference. This chemical shift δ is normally measured against tetramethylsilane (TMS) which has well shielded protons all in the same chemical environment to give a large singlet signal.
The chemical shift allows an accurate representation of the different values of the shielding constant for each nucleus present. The definition of the chemical shift is given as:
With a high chemical shift there is more de-shielding and at a low chemical shift there is more shielding. So what affects the shielding?
· Local shielding effects:- the electrons around the nuclei.
· Neighbour shielding effects:- Contribution from groups of other atoms which make up the molecule, (aromatic, conjugated, electron withdrawing/donating species).
· Solvent:- Smallest factor, large differences in solvents can cause a different electronic environment which causes a change in chemical shift. This is seen to a high level in hydrogen bonded species. The high level of shared electron density causes a broader band as well as high deshielding effects which means these peaks are found at the down field end of the spectrum.
The frequency of each nuclei is dependent on the same equation.

The main change is the difference in the magnetic fields that are met by the nuclei this is to do with the electron densities of each of the molecules.
The shielding causes the difference in energy to be smaller as the magnetic field being met is smaller this is shown by:
The shielding causes the difference in energy to be smaller as the magnetic field being met is smaller this is shown by:
The shielding constants are almost impossible to measure, it is though possible to compare the shifts of different molecules to one another, or a standard. The chemical shift scale is used for this and is normally used on a ppm level.
Mesomeric effects affect the chemical shift. This means that the resonance structures need to be taken of certain compounds to get a good idea about how the different bonding modes effect the electron density of the nucleus in question.
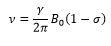
Aromatic rings have shielding and deshielding effects depending on where the nucleus in question is present. The shielding occurs in a cone shape out of the aromatic ring. This is due to an opposing current forming in the centre due to the presence of electrons in the surrounding ring. The deshielding affects are caused by the opposing current formed against this opposing current. The works with the induced magnetic field to cause an even larger chemical shift.
Mesomeric effects affect the chemical shift. This means that the resonance structures need to be taken of certain compounds to get a good idea about how the different bonding modes effect the electron density of the nucleus in question.
Aromatic rings have shielding and deshielding effects depending on where the nucleus in question is present. The shielding occurs in a cone shape out of the aromatic ring. This is due to an opposing current forming in the centre due to the presence of electrons in the surrounding ring. The deshielding affects are caused by the opposing current formed against this opposing current. The works with the induced magnetic field to cause an even larger chemical shift.
How is an NMR spectrum collected?
An NMR spectrum is collected by exciting relevant nuclei with spin I=1/2 using radio frequency pulses into two population states that are equalised. This is important as now there are an equal number of nuclei in each spin state. This is not favoured so once the magnetic field has been removed the nuclei decay to the equilibrium population difference. The data can then be processed to reveal the frequencies present.
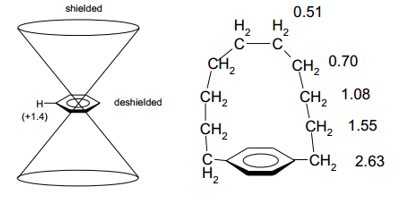
The nuclei have their spin vector pointing in any possible direction. This means overall across the sample all of the spin states are of the same energy and pointing in different directions. Once a magnetic field is induced across the sample there is an initial thermal equilibrium induced where half of the spin states are pointing with the spin and the half against the spin.
An NMR spectrum is collected by exciting relevant nuclei with spin I=1/2 using radio frequency pulses into two population states that are equalised. This is important as now there are an equal number of nuclei in each spin state. This is not favoured so once the magnetic field has been removed the nuclei decay to the equilibrium population difference. The data can then be processed to reveal the frequencies present.
The nuclei have their spin vector pointing in any possible direction. This means overall across the sample all of the spin states are of the same energy and pointing in different directions. Once a magnetic field is induced across the sample there is an initial thermal equilibrium induced where half of the spin states are pointing with the spin and the half against the spin.
This shows that before a radiofrequency has been placed across the sample the spins either lie with or against the magnetic field but there is still no vector produced apart from the slight upwards or downwards. This is obviously with the magnetic field so is hard to detect. This can be helped by pulsing a RF frequency across the sample.
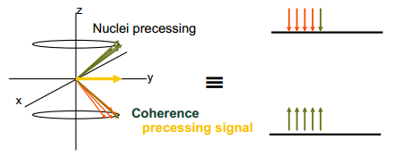
This precessing signal, an overall vector produced in an axis other than the z in this case the y axis. An NMR signal detected by the receiver is this precessing signal. The signal has to move back to thermal equilibrium somehow. This relaxation occurs by a number of different processes. This are separated into the Spin-lattice relaxation T1 and the spin-spin relaxation T2.
|
Relaxation-T1
T1 relaxation is the relaxation of the spin states in the z axis. This is to say, the relaxation of states from an excited state back to the thermal equilibrium state. This occurs when there is a fluctuating magnetic field at transition frequency, this allows the transition between the thermal equilibrium and the excited state and then back again. Molecular tumbling can cause this form of relaxation. This relaxation is also a decrease in energy in the nuclei. 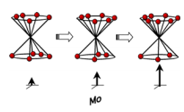
|
Relaxation T2
This is relaxation in the x (or y) direction. This does not involve the relaxation from an excited state to thermal equilibrium. This relaxation occurs through the exchange of energy with nuclear spins have magnetic moment. With a increased amount of molecular tumbling this relaxation increases in time. There is no net change in energy, there is just a loss of precessing signal. 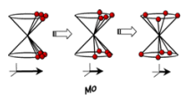
|
Pulsed and continuous NMR
There is a great importance on the difference between pulsed and continuous NMR although only pulsed NMR is now used. Continuous NMR there is RF excitation producing an opposing field in the molecule and a resonance is created by having a magnetic field swept slowly through varying strengths. This causes resonating frequencies where the Lamour frequency is satisfied. The pusled method is useful as this method allows all RF pulse to apply at torque to the nuclei turning their spins in one direction all at once. The repeated sequence of the pulses allows T1 and T2 to be measured independently.
There is a great importance on the difference between pulsed and continuous NMR although only pulsed NMR is now used. Continuous NMR there is RF excitation producing an opposing field in the molecule and a resonance is created by having a magnetic field swept slowly through varying strengths. This causes resonating frequencies where the Lamour frequency is satisfied. The pusled method is useful as this method allows all RF pulse to apply at torque to the nuclei turning their spins in one direction all at once. The repeated sequence of the pulses allows T1 and T2 to be measured independently.
Molecular tumbling
As the molecule tumbles, the orientation of each nucleus with respect to B0 stays the same, like a needle of a compass. As the nuclei move in relation to one another there are different energies depending on the position this means there is a variation of the local field.
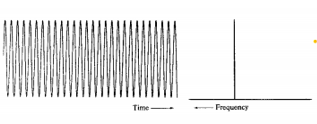
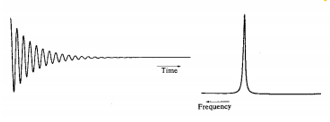
Free induction decay
As the precessing magnetisation decreases after a RF pulse there is a decrease in the strength of the signal from the receiver. The frequency is found from the rate at which the signal decreases. There is an uncertainty to this frequency which is related to the amount of maxima and minima that occur in the time.
The uncertainty is equal to:
As the molecule tumbles, the orientation of each nucleus with respect to B0 stays the same, like a needle of a compass. As the nuclei move in relation to one another there are different energies depending on the position this means there is a variation of the local field.
Free induction decay
As the precessing magnetisation decreases after a RF pulse there is a decrease in the strength of the signal from the receiver. The frequency is found from the rate at which the signal decreases. There is an uncertainty to this frequency which is related to the amount of maxima and minima that occur in the time.
The uncertainty is equal to:

This can also be related to Heisenberg’s uncertainty principle.

The decaying wave causes a broader frequency to be measured compared to a wave with constant amplitude.
Chemical exchange
An importance in taking an NMR spectrum lies in the chemical exchange. Mainly, how the environment of the nucleus varies over the course of the experiment. If there is rapid changing of the chemical environment then the “average” of these chemical environments will be measured. This means that the temperature would play an effect as the rate of change would increase at higher temperatures.
Good examples of these are the cyclohexane axial/equatorial exchange and Berry rotation transitions. As the equilibrium constant of these reactions increases the lines get broader so at the fast limit the lines can coalesce and the lines can become very narrow at an average point.
The chemical exchange rates of these systems have a difference of a Δv which can allow the rate of transition to be determined from this value:

Equivalence
This is one of the main points of NMR is the difference between chemical and magnetic equivalence and how this effects a NMR spectrum.
Chemical equivalent
This is quite self explanatory, if the nuclei are in the same chemical environment shown through c2 symmetry and σv symmetry elements. It is important to take into account any possibility of rotation about a bond when considering chemical equivalence. Many alkenes do not have chemical equivalence depending on the E or Z isomer.
Magnetic equivalence
The magnetic equivalence is based on the splitting constant caused by the different relationships between a nucleus with two different nuclei.
This is a hard yet important concept to understand.
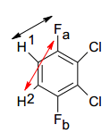
The diagram shows how there is chemical equivalence across this molecule but there is not magnetic equivalence. The basis of magnetic equivalence is that these fluoride bonding groups may be in slightly different electron configurations which means that the magnetic interactions between these groups is different.
There are ways to designate chemical and magnetic equivalence. This is done by noting different chemical environments with a different letter and different magnetic environments with a ‘.
The molecule in the diagram above would be AA’.
Spin-Spin coupling
The Spin-Spin coupling of compounds is important this is where a coupling constant J is found between nuclei. This constant is field-independent. NMR lines split into a small number of intensities and spacings which are closely linked to one another. Spin-spin coupling is transmitted through bonds. Coupling can occur through 3σ bonds and 5 bonds when conjugation is present (roughly).
Spin coupling occurs due to the difference in spin orientation that can be present. These are distributed in a pascal’s triangle way.
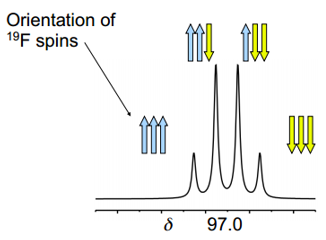
The typical values seen for proton splitting is <10 Hz.
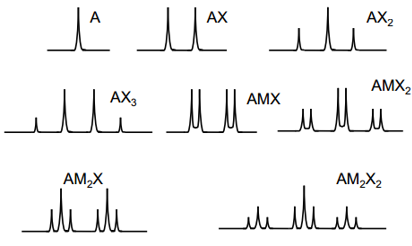
The multiplicity is a result of spin-spin coupling. Each nucleus is split by a different amount, depending on the chemical environment the splitting nucleus is in. The splitting of the signal can occur repeatedly in a process of, successive splittings, this is where there is a splitting followed by another splitting.
The multiplicity is a result of spin-spin coupling. Each nucleus is split by a different amount, depending on the chemical environment the splitting nucleus is in. The splitting of the signal can occur repeatedly in a process of, successive splittings, this is where there is a splitting followed by another splitting.
Spin decoupling
When a the effect on the splitting pattern wants to be found between compounds there can be spin-decoupled spectra taken. These involve the irradiation of a nucleus at a certain value. This causes there to be no more peak splitting between the irradiated nuclei and the other nuclei.
The best example I have of this is a question and explanation I have taken from peerwise (authored by me).
Dr. Clayden was carrying out 1H NMR spectroscopy on an unknown compound when analysed three different peaks were shown of varying multiplicities. Dr. Clayden decided to reference these as AJ, MK XL where A, M and X represent different chemical environments and J, K and L represent the number of protons present in each environment.
To study how many protons were present in each environment Dr. Clayden used spin decoupling techniques. This involved using a second radio frequency and radiating each of the chemical environment frequencies separately to remove any coupling effects that the proton being irradiated has at the time. This means the two remaining environments can be directly compared against one another.
When the A environment was irradiated:
M peak was a doublet.
X peak was a triplet.
When the M environment was irradiated:
A peak was a doublet.
X peak was a quadruplet.
When the X environment was irradiated:
A peak was a triplet.
M peak was a quadruplet.
What are the values of J, K and L?
A3 M2 X1
Spin decoupling techniques allow direct comparison from one environment to another.
When A is being irradiated: The two protons at M cause a triplet peak at X, and the proton at X causes a doublet peak at M.
When M is being irradiated: The three protons at A cause a quadruplet peak at X, and the proton at X causes a doublet peak at A.
When X is being irradiated: The three protons at A cause a quadruplet peak at M, and the two protons at M cause a triplet peak at A.
This is possible due to the irradiation of a proton environment causing the high spin state and low spin state to be in equilibrium as there is excess energy present. This means that no coupling constants that can form allowing the comparison between the remaining protons.
Hopefully this gives a good example and explanation of the process that needs to be undergone to work through these questions.
COSY NMR
Cosy NMR compares the coupling constants of the nuclei present all at once and places these on a two dimensional spectrum. This is a plot of intensity against two frequency axis. The use of the second dimension may allow separation of overlapping peaks. The correlation between these measure the connection between these sites. Compared to a 1D method this gains all of the information at once.
Signal to noise ratio
The signal to noise ratio can be increased by increasing the number of scans. The signal adds coherently whereas the noise is averaged. The noise can then be represented as:
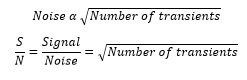
These transients can be carried out by carrying out a delay, pulse, acquisition, delay, pulse, acquisition….. etc.
Bulk magnetisation
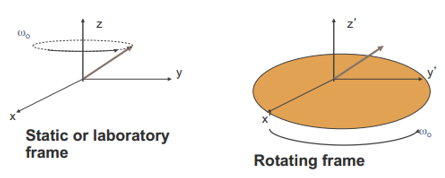
As discussed all of the spins can produce a bulk magnetisation of the material. The net equilibrium, followed by the RF pulse causes a total coherence. This rotates around the z axis. The rotating magnetism rotates with a frequency ω1. The reference is considered to rotate with the frequency ω0 (2πv0). If the roating fram rotates at the Larmor frequency the precessing magnetisation with appear stationary.
Bulk magnetisation
As discussed all of the spins can produce a bulk magnetisation of the material. The net equilibrium, followed by the RF pulse causes a total coherence. This rotates around the z axis. The rotating magnetism rotates with a frequency ω1. The reference is considered to rotate with the frequency ω0 (2πv0). If the roating fram rotates at the Larmor frequency the precessing magnetisation with appear stationary.
Another magnetic field is systematically turned on and off. The coherence is maintained by the magnetic field is not in a different direction:

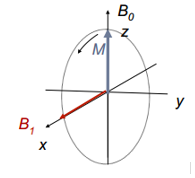
Pulse as rotations, pulse of duration tp will cause a rotation α also known as the flip angle. This means that with a long pulse the magnetic field is pushed further in the direction of the magnetic field B1.

The intensity after the pulse is given as the total magnetic moment multiplied by the angle.
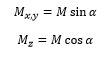
The special pulses are those that can make a large difference to the signal received. A 90° this maximises the signal but there is no signal in the z direction. This equalises the population in the two spin states. A 180° spin completely inverts the spin meaning there is no signal in the x,y direction.
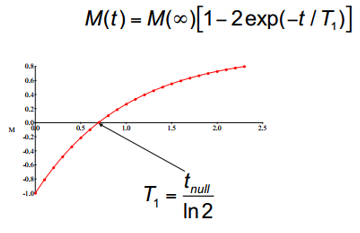
We now know that a pulse of radiation can be used to produce the maximum signal in one direction. Which, can therefore, be measured. This can be manipulated to allow the relaxation to be measured by placing all of the spins in the opposing spin state by a 180° pulse of radiation. This will then start to relax, this can be measured by a 90° pulse causing the spin state to be read. This is better described by the following diagram:
We now know that a pulse of radiation can be used to produce the maximum signal in one direction. Which, can therefore, be measured. This can be manipulated to allow the relaxation to be measured by placing all of the spins in the opposing spin state by a 180° pulse of radiation. This will then start to relax, this can be measured by a 90° pulse causing the spin state to be read. This is better described by the following diagram:
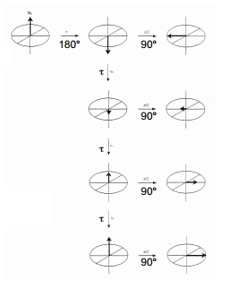
These results can be plotted on a graph so that: