Introduction to chromatography
The main types of chromatography all follow the same theoretical procedure. It is important to understand the basics of chromatography and how the interactions between compounds can occur to allow a separation.
The use of chromatography is well established and is a fast moving, fast improving field. Initially Michael Tswett used an inorganic material packed column to separate colours found in plant material by flushing solvent through the system. This was noted as being khromosgraphos or “colour writing”.
There are 3 main compnonents that need to be taken into account in all chromatography methods, these are:
The stationary phase: This can be either solid, gel or liquid. If it is a liquid it is usually bonded to the solid phase, or immobilized onto it.
The mobile phase: A fluid that is washed over the surface, this is termed eluent in elution chromatography. It is important in all of these cases that there is attraction between the stationary phase and/or the liquid phase with the analyte.
Analyte: The material that is being measured.
The process involves the separation of materials through a column due to their interactions with the stationary and mobile phase. As all materials will have different affinities to the stationary and mobile phase the movement of the materials will vary. This causes the analyte to become separated from all other compounds.
There are a number of different stationary phases that are present, these are all quite simple. All are shown below:

A detector uses the retention time and the response from the detector to give a chromatrogram this can be transferred into the retention volume which allows the movement of the same method onto different analytical machines.
This is shown below:
This is shown below:

This is where Vr is the volume of the solvent moved through the column and Fv and tr are the flow rate and retention time.

Above is an example of a chromatogram which has been expanded to allow greater view of the peaks. It can be seen from this that the each peak represents.
This is where:
· tM is the void time, this is the amount of time it takes for the solvent to pass from one end of the column to the other end of the column.
· tR1 and tR2 are the two retention times given in the spectrum.
· t’R1 and t’R2 are the adjusted retention times. This takes into account the void time of the column, this is important if the parameters are changed as the analyte may be coming out at a different point related to the flow of material.
· w is the peak width, this is important when calculating many different variables of the column. There are many that need to be considered.
Plate theory
Plate theory is a way of calculating how powerful the column is. This separates the column into static “plates” which each have a equilibrium occurring on each of the plates.
The partition coefficient is a way of calculating the concentration of the solute in both phases.
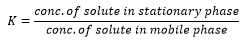
The partition coefficient is assumed to be independent of the concentration although it does vary with temperature. If the value of K is large then there is more time spent on the stationary phase which means the elution time is longer as more time is spent on the column.
Assuming the value of K is constant for the compound under chromatographic conditions is common and allows for the calculation of number of theoretical plates to be calculated.
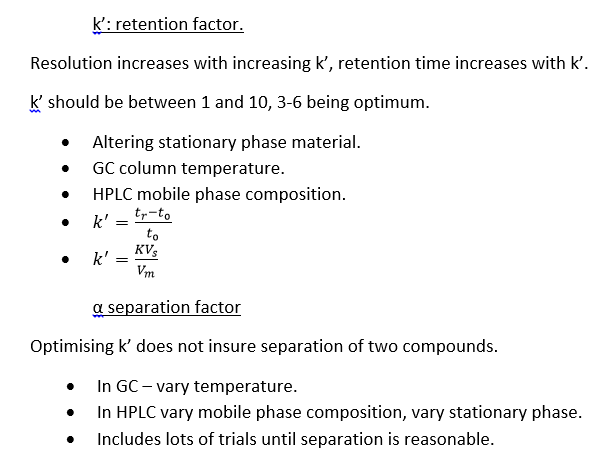
The retention factor is very important as it is a measure of the retention compared to the void time, this gives a normalised answer:
Assuming the value of K is constant for the compound under chromatographic conditions is common and allows for the calculation of number of theoretical plates to be calculated.
The retention factor is very important as it is a measure of the retention compared to the void time, this gives a normalised answer:

This directly relates to the partition coefficient K,

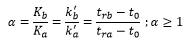
The separation factor – α is a way to tell if two compounds have separated in the chromatogram. This is due to each compound having its own partition. This gives the separating factor of a column: This is the ability for the column to separate the two compounds.
The solutions for better separation can be realted to increasing the column although this increases the peak width so is not ideal. There are many different parameters are more favourable than changing column length. Increase in column length leads to:
· Broader peaks:- each component is separated more and more as it travels through the column, although the components themselves are separated meaning the peaks become broader.
· Longer column causes an increased time as well as the column length cuasing the analysis time to increase.
· Longer column rarely allows a “better separations.
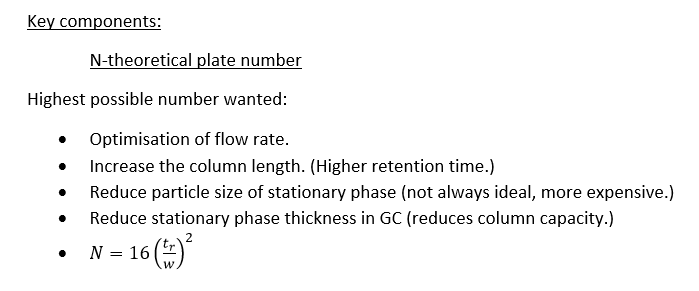
Plate number
Also known as the “number of theoretical plates” this concept comes from distillation theory. The height of the theoretical plate is the length of column in which the equivalent separation needs to be used. The separation power of a column can be assessed by the plate number, the bigger the better. TO calculate the number of theoretical plate height the following equation is used:

Assuming that these peak are Gaussian and the this gives the plate numbers observed in practice, if a specific to a particular column being used as columns can very a great deal. It is important to remember that and w are in the same units when used in this equation.
HETP
This is the height equivalent to a theoretical plate, this is based on the column efficiency and can be gauged by the height of the theoretical plate which is related to the plate number N.
HETP
This is the height equivalent to a theoretical plate, this is based on the column efficiency and can be gauged by the height of the theoretical plate which is related to the plate number N.

Separation and resolution
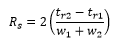
For peaks to be quantified a resolution of around 1.5 is needed, the way that this is calculated is by taken the relative widths of the peak and their respective heights.
The calculation is carried out by mreaureing the retention times and the peak widths.
For peaks to be quantified a resolution of around 1.5 is needed, the way that this is calculated is by taken the relative widths of the peak and their respective heights.
The calculation is carried out by mreaureing the retention times and the peak widths.
The varying in resolution can be easily seen in the graph below:
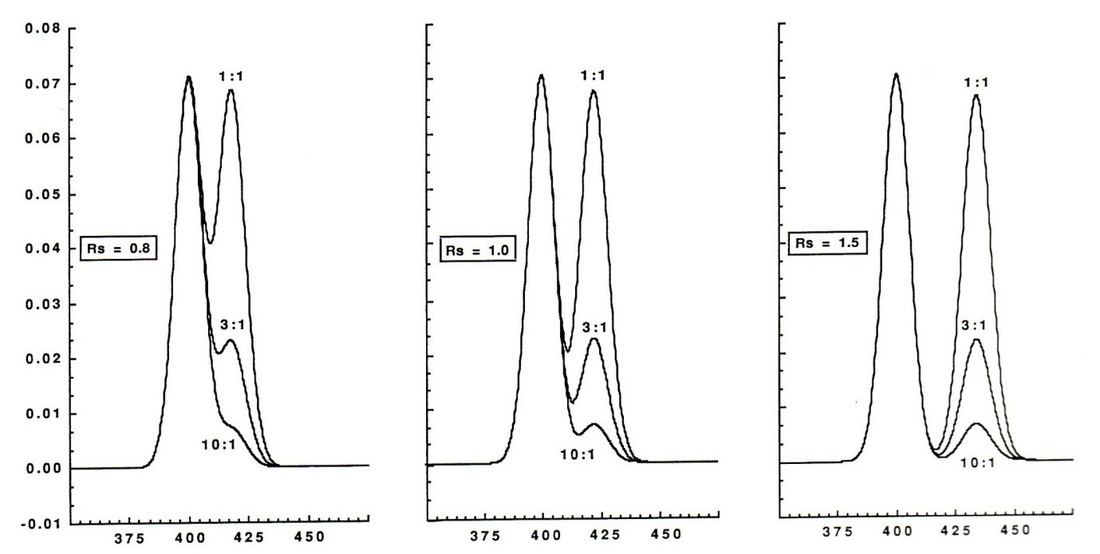
Nowadays it is common for software in the machine to carry out this type of analysis. Although 1.5 is the golden number for quantification for mass spectrum analysis this needs to be around 1.8-2.0 resolution otherwise there can be interference between the two compounds in the mass spectrum run.
Rate theory
This is a highly mathamtical reasoning to the separation of peaks in a chromatogram. The number solvent diffusion and flow paths as well as the prediction effects on column performance factors. There can be a number of different performance factors.
Van Deemter produced the initial rate theory, this was based on the Gaussian distribution similar to that of plate theory. In the process Van Deemter was producing a better model for the separation process. This related column separation efficiency to band broadening. This also looks into the amount of linear flow and how the velocity of particulates can differ through a column.
Band broadening
The band broadening is the peak width. This is governed by a series of processes. One of these is the fact that there are varying levels of diffusion. The components in the mobile phase naturally diffuse as they move through the column, this is closely related to the diffusion coefficient. The flow rate has a large effect on this sort of diffusion.
Eddy diffusion takes into account that the particles while travelling through a packed column will travel around the stationary phase in different ways, this means that some particles can travel through the column significantly quicker through purely coincidental reasons. This is relatively independent of the flow rate.
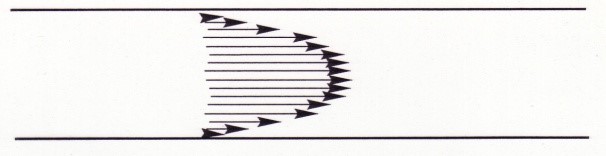
Another difference is the Laminar flow of the materials in the column. This is where there is more rapid flow at the centre of a liquid then there is at the sides.
Rate theory
This is a highly mathamtical reasoning to the separation of peaks in a chromatogram. The number solvent diffusion and flow paths as well as the prediction effects on column performance factors. There can be a number of different performance factors.
Van Deemter produced the initial rate theory, this was based on the Gaussian distribution similar to that of plate theory. In the process Van Deemter was producing a better model for the separation process. This related column separation efficiency to band broadening. This also looks into the amount of linear flow and how the velocity of particulates can differ through a column.
Band broadening
The band broadening is the peak width. This is governed by a series of processes. One of these is the fact that there are varying levels of diffusion. The components in the mobile phase naturally diffuse as they move through the column, this is closely related to the diffusion coefficient. The flow rate has a large effect on this sort of diffusion.
Eddy diffusion takes into account that the particles while travelling through a packed column will travel around the stationary phase in different ways, this means that some particles can travel through the column significantly quicker through purely coincidental reasons. This is relatively independent of the flow rate.
Another difference is the Laminar flow of the materials in the column. This is where there is more rapid flow at the centre of a liquid then there is at the sides.
Mass transfer is seen when there needs to be partitioning process between the mobile and stationary phase, at faster partitionaing there is decreased in band broadening. This is explained by a slow partition rate means that compounds can be retained on the stationary phase for a long time broadening the peaks.
The Van Deemter equation
The Van Deemter equation
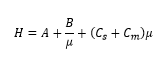
This is where:
· μ is the mobile phase flow rate.
· A is the Eddy diffusion: independent of the flow rate.
· B is the longitudinal diffusion: inversely proportional to flow rate.
· C is the mass transfer factor which is proportional to flow rate.
· H is the theoretical plate height (smaller is better).
This shows there are 3 different terms all with different relationships to the flow rate.
Van Deemter plot
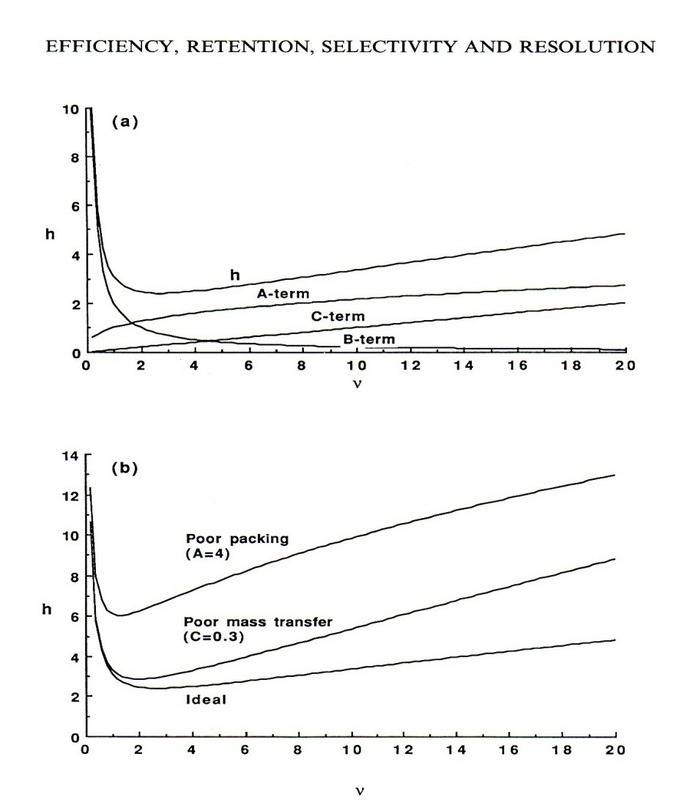
The Van Deemter plot is very effective at representing the theoretical plate height at different flow rates. This shows that there is an optimum amount height at a flow rate of around 1-5.
The van Deemter plot also shows how there is comparitvley little variation in the flow rate to theoretical plate height with HPLC to GC.
To achieve maximum resolution the flowing factors need to be taken into account:
The van Deemter plot also shows how there is comparitvley little variation in the flow rate to theoretical plate height with HPLC to GC.
To achieve maximum resolution the flowing factors need to be taken into account: