The way an analytical process is planned and carried out is one of the most fundamental understandings of analytical chemistry.
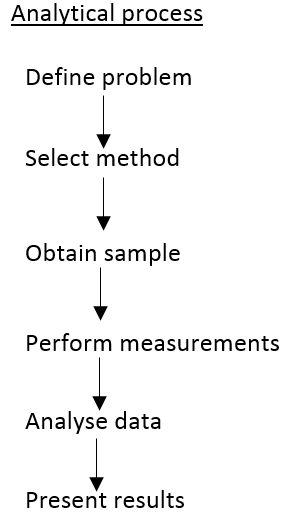
Define problem
The most important part of analytical chemistry, without understanding the problem an answer cannot be found. This should start as a very top-level question surrounding the problem such as: "Is the water safe to drink?" Or, "Is this product fake?"
Method selection
|
Accuracy and precision
The accuracy and precision is important in an analytical method. If an accurate (close to true value) cannot be found, the analysis isn't good enough. |
Robustness
Whether or not the technique can be used for multiple analysis methods or can it only find a single analyte. |
Ruggedness
Can the method cope with slight deviations from the normal and still give meaningful data. With ultra-sensitive techniques a slight increase in sample could cause an overload etc. Meaning the method is not longer usable. |
|
Validation criteria
The techniques need to be validated to be able to be used. If the technique is mostly unheard of or not used then this is going to be validation issues here. |
Availability of equipment and cost
Is the equipment expensive and how available is it to access? Many of the best procedures come at a very high cost so its worth keeping in mind how accurate the data needs to be. |
Scale of operation
The scale of operation takes into account how large the samples will need to be and if they are capable of being carried out on the technique used. |
Sensitivity
Sensitvity is one of the more important aspects of method selection, as it is a test on whether or not the analyte is actually capable of being analys
Sensitvity is one of the more important aspects of method selection, as it is a test on whether or not the analyte is actually capable of being analys

The working curve (shown left) is a good example of how sensitive a procedure is. It is important that the analyte concentration shows up past the limit of quantification ideally and is not as high as the limit of linearity. Once the limit of linearity is reached the change in concentration is not equal to the change in response making the analysis useless.
The gradient of this curve is a measure for how sensitive the analytical process is. As large differences in signal for a small difference in concentration are favoured as this allows for a more precise concentration reading.
The gradient of this curve is a measure for how sensitive the analytical process is. As large differences in signal for a small difference in concentration are favoured as this allows for a more precise concentration reading.
|
The limit of detection
This is where the signal produced by the analyte is three times the amount of noise produced (represented by the standard deviation of noise). This can also be represented as the S/N=3. This is where it is 97.5% certain that the peak is caused by an analyte and not noise. |
The limit of quantification
This is found after the limit of detection where the signal is ten times that of the noise. This can be represented by S/N=10. This is where the difference between the signal and noise is large enough that it is unlikely that noise is much of the contributing factor at all. |
The limit of linearity
The limit of linearity is where the response from the detector is no longer linear to the concentration change of the analyte. This makes it almost impossible to accurately predict the change in concentration of analyte and therefore the system cannot be used above this value. |
Obtain sample
Obtaining the sample is one of the most important aspects of the procedure but also one of the most specilised to the procedure itself this makes it very important that the sampling carried out is representative of the bulk. This means that random sampling is very important and there is as little bias as possible in the sample taken. This is another time where environmental factors are worth remembering as any aging of the sample or changes in the sample can cause a large difference in the results obtained.
Performing measurements
It is very important that the measurements follow distinct procedures and protocols.
A procedure is written instructions for carrying out an analytical method. This means that the analytical method is always carried out in exactly the same fashion, a procedure is usually what one person will follow for each section and these procedures together make up a protocol.
A protocol is the detailed set of instructions that design, conduct and report a test, study or trial. This can be seen as sampling methods, analysing methods, and reporting methods. Procedures are normally set down by higher bodies and these normally feed into an over riding protocol.
Signal and noise
Signal
The signal is one of the most important parts of the analytical process. The signal is made up of both noise and the analyte response. There is great importance in understanding this. The analyte "signal" is actually both response and noise mixed together. This is where there is importance that the analyte peak is big enough to not be mistaken for noise and the noise is reduced by as many ways as possible.
The signal is one of the most important parts of the analytical process. The signal is made up of both noise and the analyte response. There is great importance in understanding this. The analyte "signal" is actually both response and noise mixed together. This is where there is importance that the analyte peak is big enough to not be mistaken for noise and the noise is reduced by as many ways as possible.

Noise
|
Thermal noise
Thermal noise is caused by agitation of charged particles in the electric circuit. There is great importance on reducing the temperature to minimise the noise. It is also worth noting that this is related to the frequency band width so is independent of the frequency at each point of the experiment. 
|
Shot noise
Shot noise is caused by the natural variation of electrons as they reach the detector. This is dependent on the current and the frequency band width also. I is the average direct current and e is the charge on an electron. 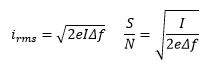
|
Flicker noise
Flicker noise is unique in the sense that it varies throughout the experiment. This is where the frequency has a inversely proportional relationship to the amount of noise there is present. 
|
Environmental noise
Environmental noise is also important as it can change quite rapidly and environmental effects need to be taken into account for many different reasons. It is always worth remembering that the environment can affect all analytical methods and most of these have obvious features built in to minimise this affect such as HPLC ovens or reflective boxes for Raman.
Environmental noise is also important as it can change quite rapidly and environmental effects need to be taken into account for many different reasons. It is always worth remembering that the environment can affect all analytical methods and most of these have obvious features built in to minimise this affect such as HPLC ovens or reflective boxes for Raman.
Improving the ratio
|
Grounding and shielding
Grounding and shielding are two obvious examples of ways to decrease noise. In these cases the electronic systems are protected and kept in the most stable environment possible. |
Difference amplifiers
These are amplifiers that measure and amplify the difference in response between a control and a sample. This can help cancel noise from the samples as they would be very similar and the analyte response would not be. |
Analog filtering
Whether the analytical experiment is being carried out at high or low frequency will allow a minimum/maximum deviation in response to be measured and filtered out. This is useful for tidying data but information can be lost. |
Modulation-demodulation
The modulation of a signal is quite complex but makes sense when worked through systematically. It starts with a low frequency signal are converted to a much higher frequency this is where flicker noise is much less of an issue. This process is called modulation. This signal can then be run over with a high pass filter making this signal much cleaner and reducing any noise from the amplifier. This signal can then be demodulated and run over with a low pass band filter. This produces a low frequency signal but a high amplitude.
The modulation of a signal is quite complex but makes sense when worked through systematically. It starts with a low frequency signal are converted to a much higher frequency this is where flicker noise is much less of an issue. This process is called modulation. This signal can then be run over with a high pass filter making this signal much cleaner and reducing any noise from the amplifier. This signal can then be demodulated and run over with a low pass band filter. This produces a low frequency signal but a high amplitude.
|
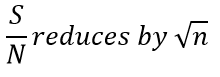
Ensemble averaging
Ensemble averaging is a very useful process in which multiple spectra are taken and due to the consistent signal the addition should cause a larger peak. 
Boxcar averaging
This is carried out by drawing boxes and regular intervals throughout the data and averaging all of the points in the box to one single point. This is very useful when running at a high frequency on a low frequency peak but can easily miss out large data spikes as these can be averaged down to the points surrounding them. This is a useful technique but must be remembered that it does not create more information of make the exsiting information look better, it is only present as a way of clearing up data and finding a larger peaks. It should also be noted that if statistical analysis is going to be carried out on the data it should not be carried out after boxcar averaging. The advantage is that this method is time independent and does not require repeat samples etc. purely a large number of samples to start with which are then averaged. |
Smoothing
The smoothing of a line is a moving weighted averaging, this takes data points and a number of surrounding data points and produced an average for that region. This doesn't take as long as ensemble averaging but does not "improve" data, the effects are purely cosmetic. Smoothing underestimates errors and should not be used before further statistical methods. 
Fourier transformation
The time domain signal can be transformed into the frequency domain. This takes a signal of amplitude against time and plots the frequency of the wave with amplitude. This allows fast data collection as it can represent all of the frequencies together. 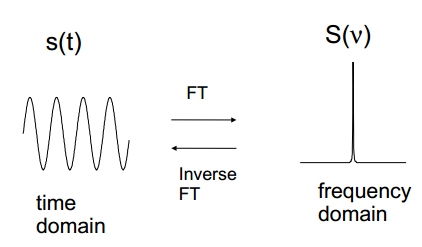
|
Errors
|
Random errors
Random errors are found in every analytical process. This is the natural fact that all processes form a Gaussian relationship with one another. |
Systematic error
Systematic errors are found when a process is carried out incorrectly every time causing an identical deviation from the true value every time. |
Gross errors
These are errors that mean that the true value is not found, these are normally known about as they occur and are not considered an issue for statistical analysis as the result is disregarded. |
Standards and calibration
External standard/ Calibration curve
A calibration curve can be produced by using a plot of the response as a function of the concentration, weight volume etc. of an analyte. The response from the sample can then be compared to the calibration and the concentration found. This can be very accurate although it is not always the best. It is also worth remembering that a good line of best fit is not always ideal, a 99.998% R2 doesn’t mean the data is good for a calibration.
There are other issues with the external standard is that there can be issues with the system on a run and this cannot be picked up until a test or a recalibration which must be carried out periodically.
A blank must be carried out as this can show where the absorption of each group can occur. It is important to remember that the calibration curve is assumed to be completely accurate this can cause errors in the experiment especially is the calibration curve hasn’t been completed properly and cannot be used accurately.
Internal standard
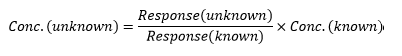
The use of an internal standard is the most accurate use of a standard this is due to the benefits of adding the standard directly to the sample being analysed. This is one of the best uses standard as it undergoes the same changes during the analysis method. This can make a difference in the event of sample loss as this would cause a decreased response although both will have the same decrease in response and therefore the comparison between the two can be made.
There aren’t many issues with an internal standard accept for the fact that it is important that the internal standard is similar enough to react to the same changes yet different enough to keep the resolution of the sample.
With LC-MS it is usual for a dueteriated isomer to be used, this behaves incredibly similar to the analyte although the m/z is slightly different. This is especially useful when analysis can be complex and can lead to accurate answers.

Standard edition
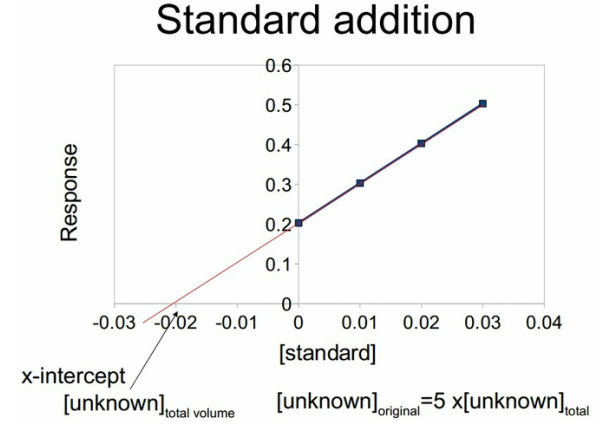
This involves spiking a solution to allow a relation between the signal and the unknown concentration. This can monitor the change in concentration which can then allow the knowledge of the concentration present. This is preferred in methods where only a small amount of sample is obtained or the sample will be affected too greatly by an internal standard.
The standard addition can then be extrapolated back the x-intercept is the concentration of the unknown in the total volume. This can then be multiplied by the amount of dilutions taken for the original solution to be found. It is important to carry out the same treatment that was used for the standard concentrations on the standard concentration found. So in the case below the sample was diluted by a factor of 5 so the x value was then multipled by a factor of 5. It is recommended to work backwards through the standard.
Method used
The best method to use for maximum precision and accuracy is the internal standard method. This gives the best example of how small changes in a system effects both peaks allowing for highly accurate analysis. For a large number of routine samples it is normally accepted that a external standard can be used. Running these standards is usually very easy to produce a calibration curve and does not add much time onto the analysis. The use of standard addition is hopeless in this event as it will easily double or triple the number of runs needed.
Validation
Validation
Validation
It is important to be able to demonstrate that the analytical method chosen is suitable for its intended purpose. This means that many of the values discussed above need to be reaffirmed such as.
- Detection limit - discussed above, when analyte is separate from noise.
- Quantification limit - discussed above, when analyte is far enough away from noise to be quantified.
- Accuracy- that the analytical procedure gives a close enough value to the accepted value.
- Precision- that the deviaition of the results from the mean can be accurately predicted.
- Linearity- that the concentration and detector response remains linear throughout the experiment.
